The csv file used for this lab contains details for the Cotton Bales such as the cost and weight of each and every individual Bale along with the name of the Brokers. Throughout the data sets there were missing values for different columns our first task was to fill those in. We did this by looking at actual data logs from 1855 which were written in cursive. The person we added in was JL Hawes.
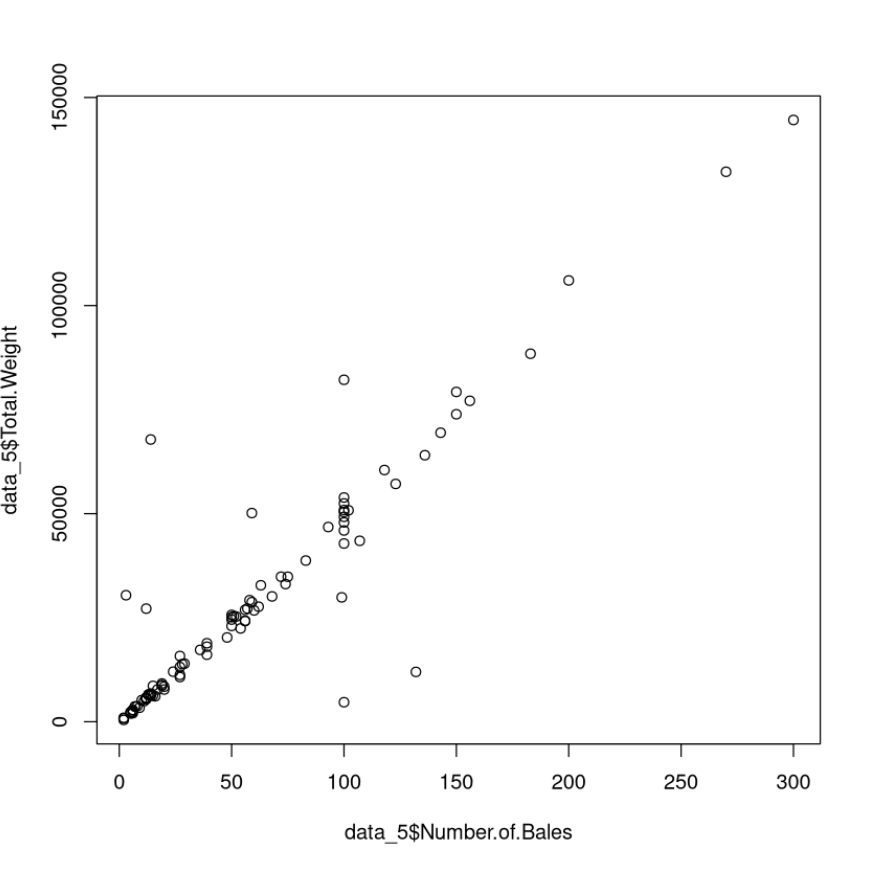
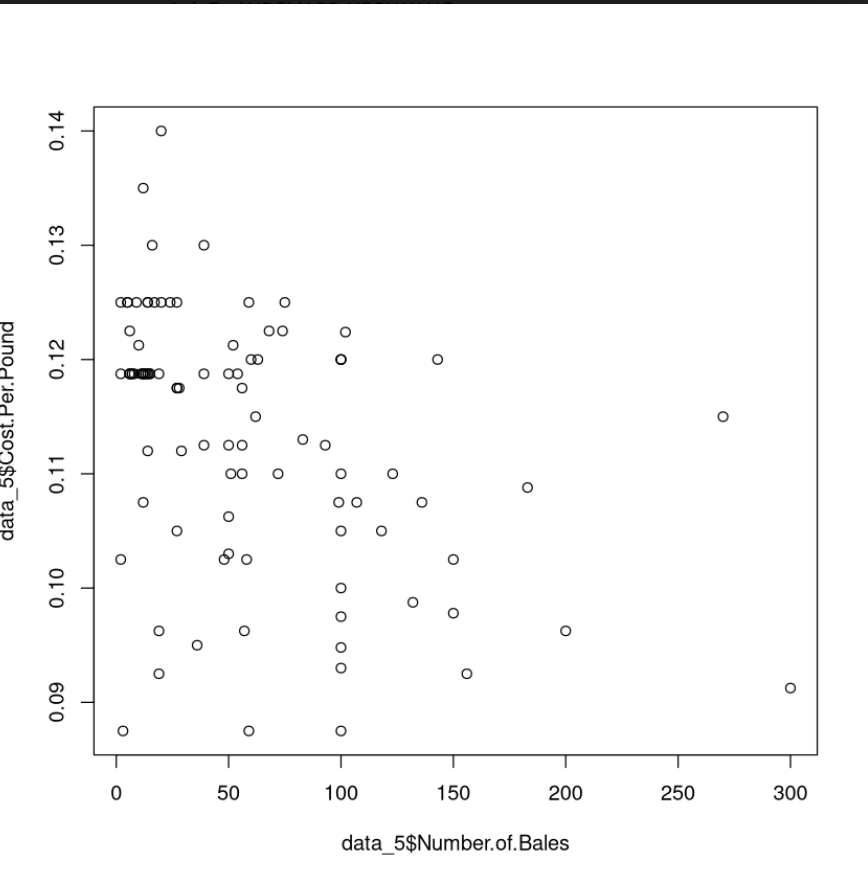
The next step was to remove all of the NA values from the columns. The Na values are values that can not be computed by R. In the next step of analyzing this data we plotted a scatterplot of the total weight and the number of bales. This was a visual representation of the data frame. To further analyze this data we find out the correlation and variation between the two vectors. In the first case the graph was linear so it is a positive correlation. The next scatterplot was with Number of Bales on the x axis and the Cost per pound on the y axis. This the correlation was vaguely negative as the scatterplot was not linear.
The next step was to get a list of people who bought cotton in the U.S. south and sold it to Benjamin Bates. This was done by using the unique function. Then we did some further sub setting in order to arrange the data in a way that is easier to understand.
Then we created a function that uses the data frame and broker name as parameters. It returns a data frame that contains only rows that include the selected cotton broker in the Broker column.