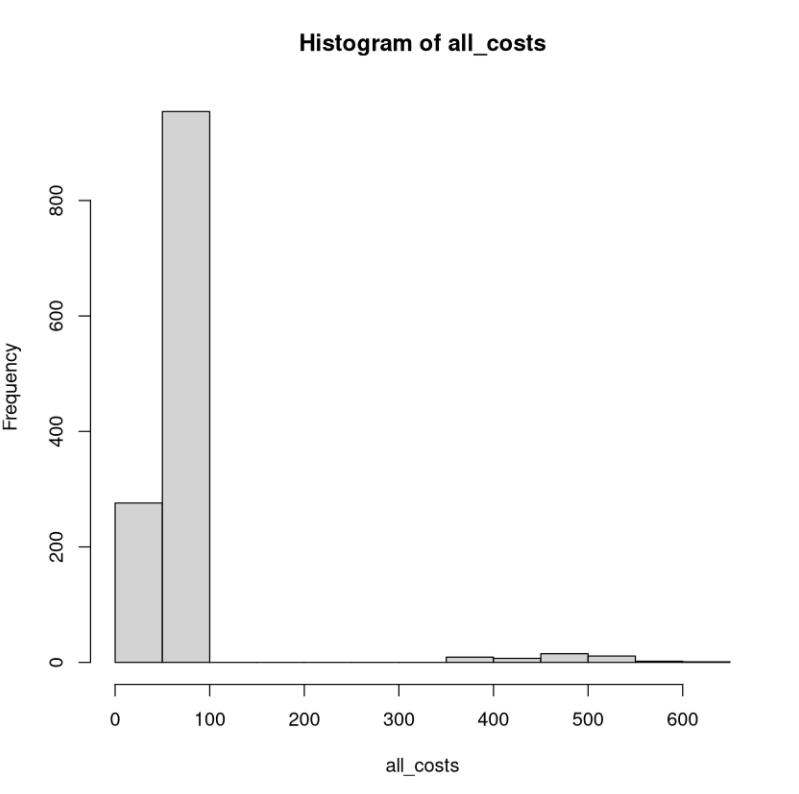
In this lab we looked at the goal values and actual values for donations to bates over the years. Towards the end we worked on the number of cotton bales and the cost of each subset of bales. This was very interesting as we could easily gauge the hardships faced by the African American cotton mill workers. To get the values in all_costs I multiplied the subsets of costs to the subsets of bales. From this visualization we can infer that the bales that have a high cost have a very low frequency and most of the bales are 0-100. This emphasizes on my point on the hardships the mill workers had to go through for the satisfaction of the mill owners.